Recently, Bitcoin has climbed back above $99,000, but the trends seen in Open Interest may raise questions about the sustainability of this surge.
Recent Spike in Bitcoin Open Interest Coincides with Price Rally
In a recent post on X, CryptoQuant analyst Maartunn discussed the connection between Bitcoin Open Interest and the latest price surge. The term “Open Interest” refers to the total number of active positions related to BTC on all derivatives exchanges.
An increase in this metric indicates that derivatives traders are opening new positions. Typically, this results in a rise in the overall leverage within the market, which can lead to greater price volatility for the cryptocurrency.
Conversely, if this indicator declines, it suggests that holders are either willingly closing their positions or being liquidated by their trading platform. After a leverage flushout, the cryptocurrency may experience a more stable market behavior.
Below is the chart shared by the analyst, illustrating the trends in Bitcoin Open Interest along with its 24-hour percentage change from the past week:
The metric value has experienced significant growth over the past day | Source: @JA_Maartun on X
The graph indicates a swift increase in Bitcoin Open Interest, coinciding with the recent recovery in the coin’s price. At its peak, the 24-hour percentage change reached 7.2%, a notable figure.
While it’s common to see increased speculative activity following a sharp cryptocurrency move, excessive speculation can signal potential risks. In a high-leverage context, the likelihood of mass liquidations rises significantly.
As a result, the volatility stemming from such chaos in the derivatives market could swing the cryptocurrency either way. However, spikes in Open Interest typically serve as obstacles to sustained price rallies. Thus, the recent Bitcoin rally may similarly end in a volatile downturn.
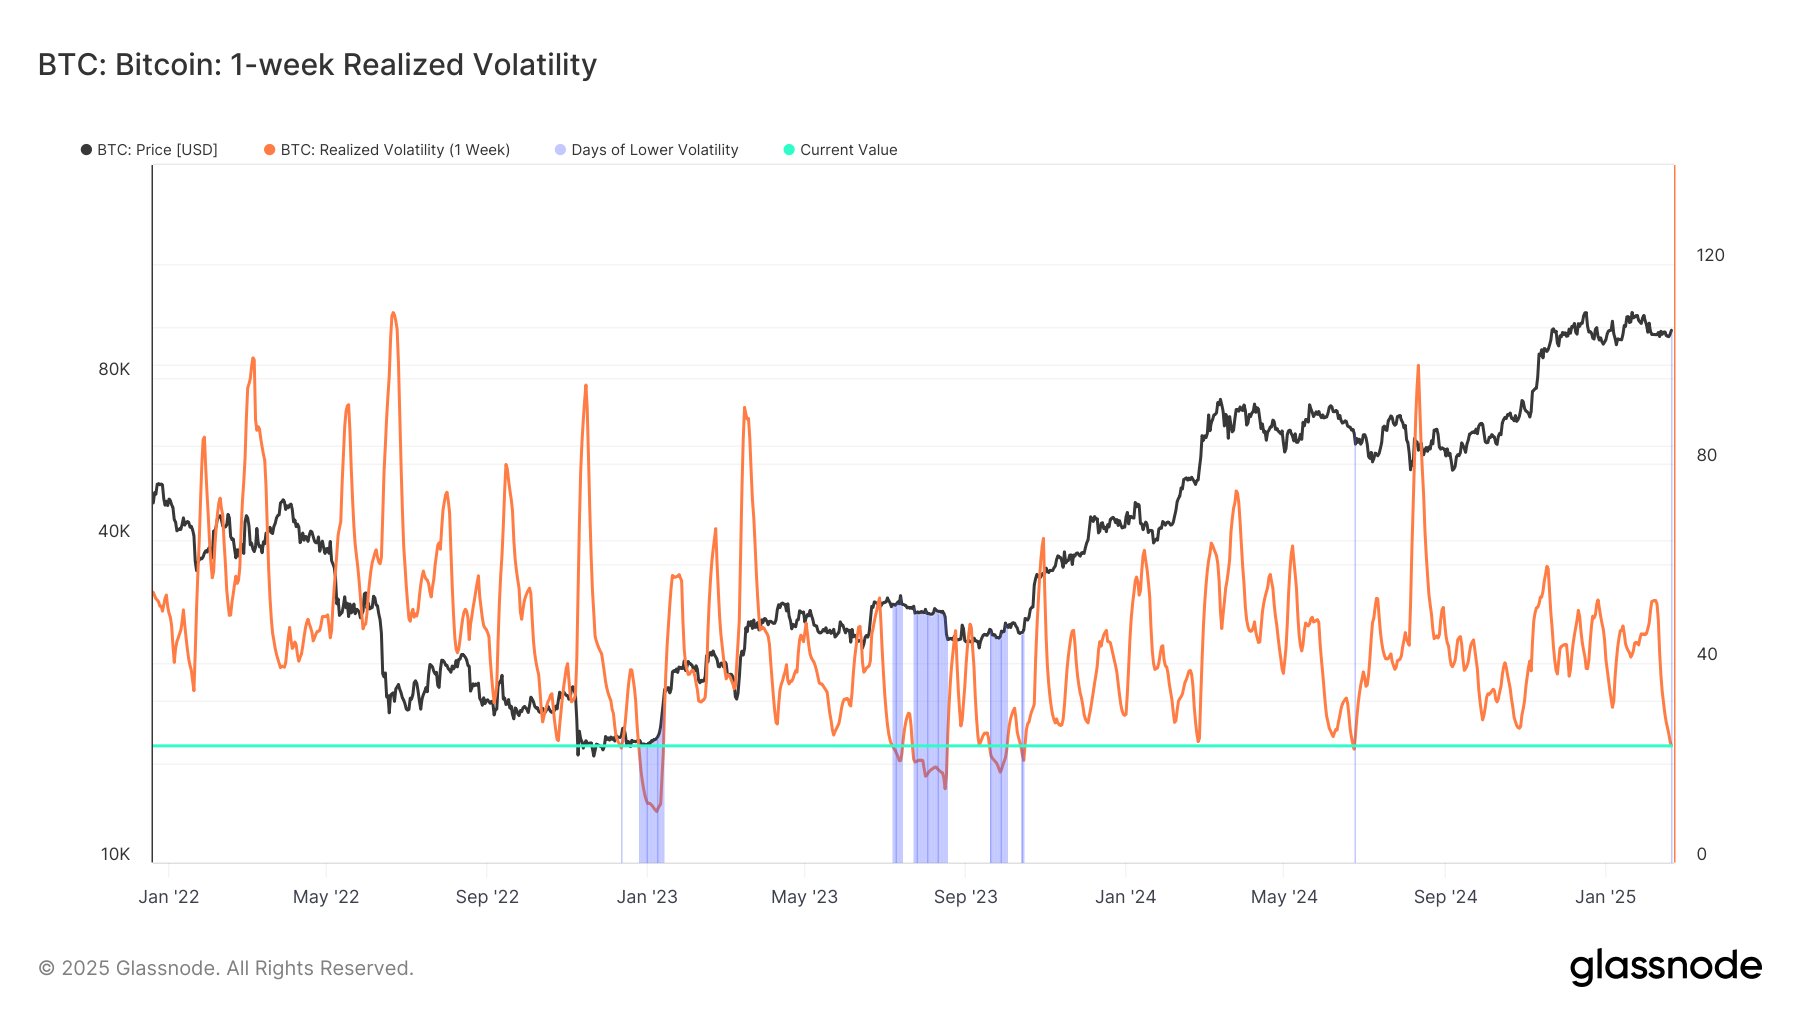
Open Interest trends are not the sole indicators suggesting upcoming volatility, as noted by analytics firm Glassnode in a post on X.
Trends in BTC Realized Volatility over recent years | Source: Glassnode on X
The chart depicts the 1-week Realized Volatility, an indicator measuring the percentage change between Bitcoin’s highest and lowest prices over the past week.
The graph shows a recent drop in this metric, suggesting that the asset has been trading within a very tight range. “In the past four years, it has dipped lower only a few times – e.g., in October 2024 (22.88%) and November 2023 (21.35%),” according to Glassnode. “Previous compressions in the market have often led to significant price movements.”
Current Bitcoin Price
After a 2% increase in the last 24 hours, Bitcoin has stabilized above the $99,300 mark.
The price of Bitcoin has shown an upward trend in recent days | Source: BTCUSDT on TradingView
Image credits: Featured image from Dall-E, Glassnode.com, CryptoQuant.com, chart from TradingView.com

