On Friday, the price of Bitcoin appeared poised to reach $100,000, buoyed by the U.S. Securities and Exchange Commission’s (SEC) announcement of dropping its lawsuit against crypto exchange Coinbase. Nevertheless, the leading cryptocurrency could not maintain this upward momentum following a $1.4 billion exploit of the ByBit exchange.
Currently, Bitcoin’s price is lingering above $96,000, and recent on-chain data indicates that specific volatility metrics are approaching historically low levels. Below, we explore how these latest volatility trends might influence BTC’s price performance in the upcoming weeks.
Is A BTC Price Rally Imminent?
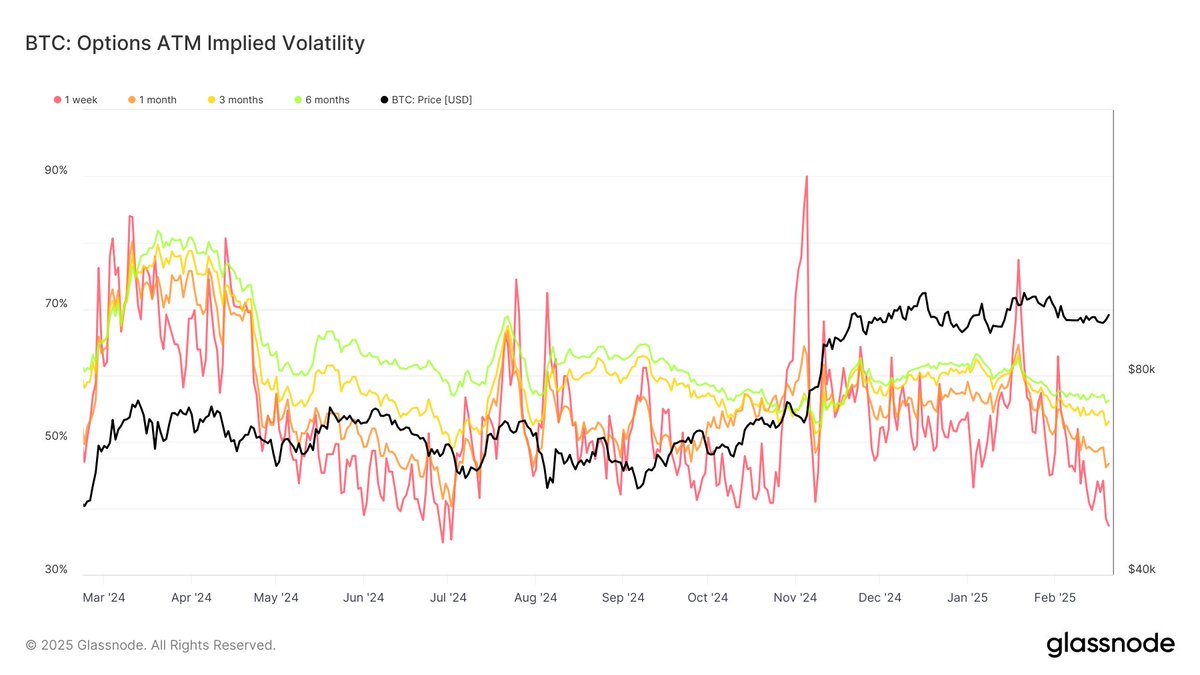
A recent update from the crypto analytics firm Glassnode on the X platform detailed how two significant volatility indicators reaching historically low levels could affect Bitcoin’s price and its future direction. The two key metrics being examined are the 1-week “realized volatility” and “options implied volatility.”
To provide context, realized volatility (or historical volatility) quantifies how much the price of an asset (in this case, BTC) has fluctuated over a defined timeframe. Conversely, implied volatility gauges the probability of future price changes in an asset.
According to Glassnode’s data, Bitcoin’s 1-week realized volatility recently fell to 23.42%. The on-chain analytics firm pointed out that this figure is nearly at historical lows, as BTC’s realized volatility has only dipped below this level a handful of times in the last four years.
Source: Glassnode/X
Importantly, the 1-week realized volatility dropped to 22.88% and 21.35% in October 2024 and November 2024, respectively. These points served as bottoms, with the metric bouncing back from such levels in the past. Historically, drops in realized volatility have preceded substantial price movements, raising the likelihood of either a breakout or a correction.
Source: Glassnode/X
At the same time, Bitcoin’s 1-week options implied volatility has significantly decreased to 37.39%. This metric is approaching multi-year lows, last observed in 2023 and early 2024. Notably, significant market movements in Bitcoin occurred the last time implied volatility was around this level.
Moreover, it’s essential to mention that the longer-term options implied volatility reflects a different pattern. The 3-month implied volatility is about 53.1%, while the 6-month indicator is at approximately 56.25%. This suggests that market participants foresee increased volatility in the coming months.
Current Bitcoin Price Overview
As of now, Bitcoin is priced at approximately $95,340, representing a decline of over 3% in the previous 24 hours.
The price of Bitcoin on the daily timeframe | Source: BTCUSDT chart on TradingView
Featured image from iStock, chart from TradingView
