Recent on-chain data indicates that smaller Bitcoin holders have intensified their selloff, whereas the largest investors are increasing their purchases.
Divergence in Bitcoin Accumulation Trend Score Among Holder Groups
In a recent update on X, the on-chain analytics firm Glassnode shared insights on the current trend in the Accumulation Trend Score across various Bitcoin holder cohorts.
The Accumulation Trend Score serves as a metric that indicates whether BTC investors are in an accumulation or distribution phase. This score is derived not only from the balance changes in investors’ wallets but also considers the size of the addresses.
A value above 0.5 suggests that larger investors (or a significant number of smaller investors) are acquiring Bitcoin. The nearer the score is to 1, the more pronounced this behavior appears.
Conversely, when the score falls below 0.5, it implies that the market might be experiencing a distribution phase, with a low point of zero indicating extreme distribution.
For the purpose of this discussion, the specific Accumulation Trend Score of interest is not the overall network score, but rather the scores that reflect the behavior of distinct investor groups.
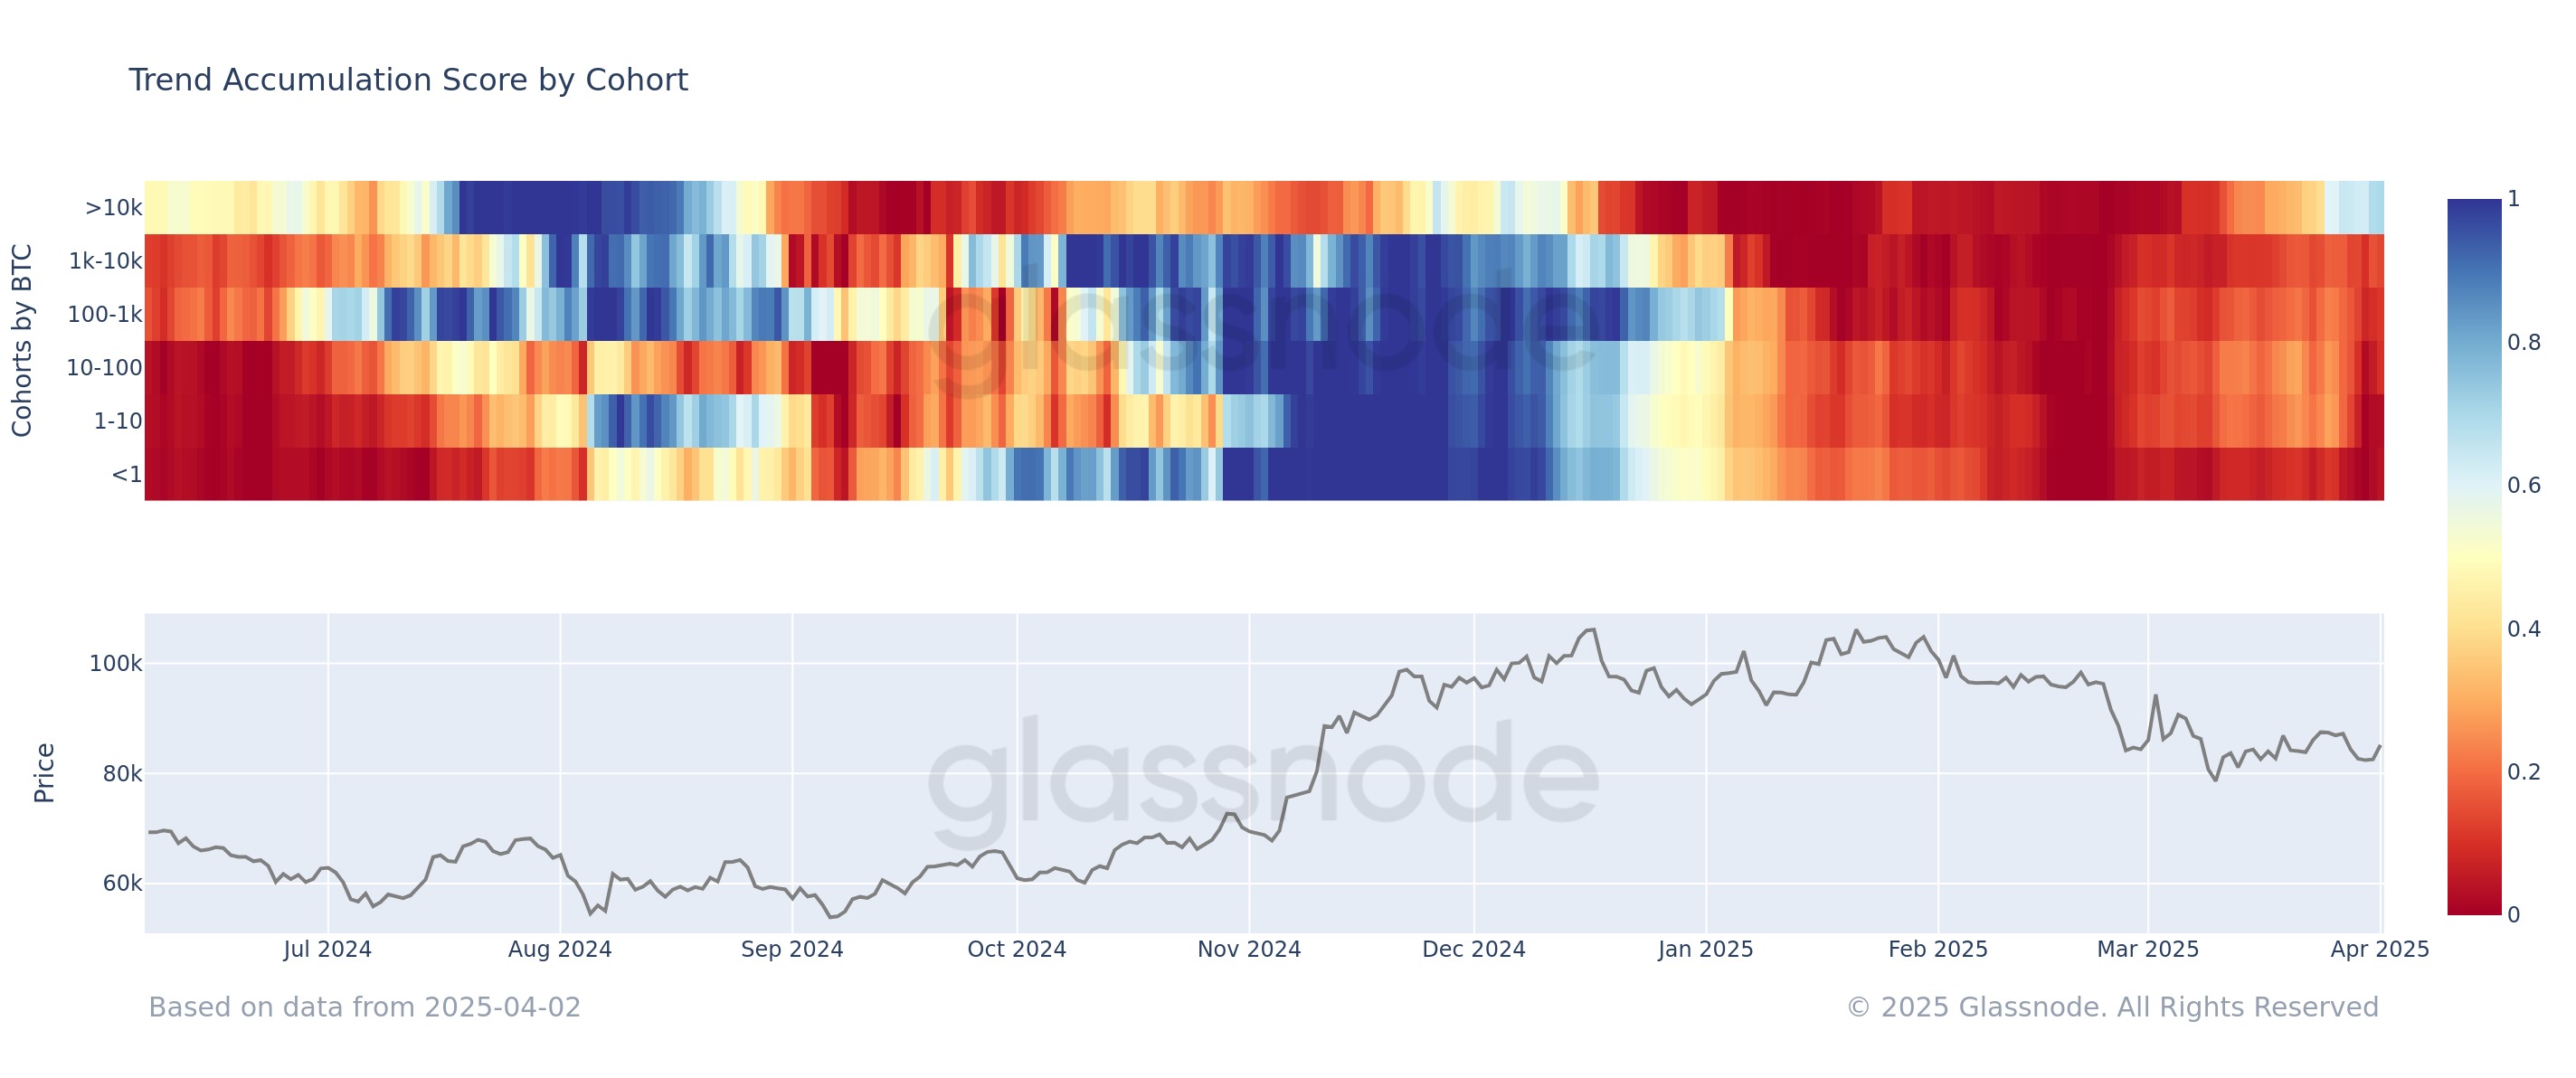
Addresses or holders have been categorized into cohorts based on wallet size. Below is the change in the Accumulation Trend Score for each group over the past year:
It appears that the majority of the market is currently in a distribution phase | Source: Glassnode on X
The chart illustrates that the Bitcoin Accumulation Trend Score neared the 1 mark for most investor groups between November and January, indicating significant accumulation during that period. Along with this buying activity, Bitcoin enjoyed a bull run surpassing the $100,000 mark.
However, as the year began, a transition to selling occurred, bringing the indicator close to zero for all cohorts by February. This led to a bearish reversal due to the distribution taking place.
In March, selling activity by investors eased somewhat, yet the overall market condition remained one of distribution. The chart reveals that holder behavior has been relatively consistent throughout most of the year, but a divergence has recently emerged.
Retail investors (those holding less than 1 BTC) have intensified their distribution again, with the metric dropping below 0.2. In contrast, the largest entities holding over 10,000 BTC have turned their attention to accumulation, with their score approaching 0.6.
As bullish momentum waned earlier, these ‘mega whales’ were among the first to initiate a major selloff. With this segment of smart money now diverging from the rest of the market once again, a potential trend shift for Bitcoin could be on the horizon.
BTC Price Update
Bitcoin has started April with some positive momentum, with its price rising to $84,900.
The value of the coin has been in a consolidation phase recently | Source: BTCUSDT on TradingView.com
Image credits: Dall-E, Glassnode.com, chart from TradingView.com
Editorial Process at Bitcoinist focuses on delivering well-researched, precise, and unbiased information. We adhere to strict sourcing standards, with each page meticulously reviewed by our team of leading technology experts and experienced editors. This rigorous process ensures our content’s integrity, relevance, and value for our readers.
